Platform / Tz0 Performance
Module · performance
Tz0 Performance
Workstation performance and health
A slow machine has a cause. And it shows up before it turns into a ticket.
Continuous measurement · the chart exists before the ticket

The whole estate
Every machine reports. The server makes sense of the whole.
The agent on each machine sends CPU, memory and disk to the Tz0 server, which reads the estate as a whole — on the company network, working from home or on the road. You stop looking machine by machine and start seeing where the bottleneck is, before anyone raises a ticket.
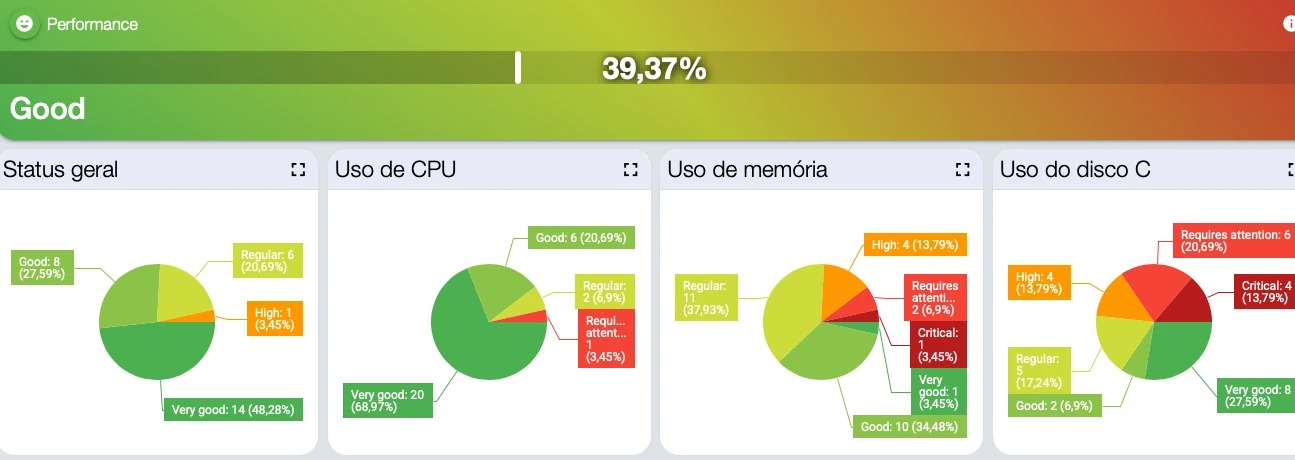
Console capture from an estate in production. Machine identification replaced; figures untouched.
What it measures
Three resources, one question: can this machine cope?
Tz0 Performance tracks CPU, memory and disk on every machine over time — not at the moment somebody complains. It shows the whole estate on one yardstick, drills down to a specific machine and tells you what to do about it: replace the disk, add memory, or retire what is sitting idle.
CPU, memory and disk over time
The agent records the use of each resource hour by hour. The screen shows the curve of the week, not a one-second spike — that is the difference between “it is slow right now” and “it lives at its limit”.
The estate on a single scale
Every machine gets a grade — from “very good” to “critical” — for CPU, for memory and for disk. You can see from across the room which machines are struggling, and at what.
Recommended action
Where there is too much headroom, the module suggests a downgrade; where space is short, a disk upgrade. Replacing hardware stops being a hunch and gets a measured reason.
How it works
From the reading to the replacement call.
Measurement is continuous and incremental: by the time the ticket arrives, that machine’s curve is already on the server.
Console
From the estate down to the machine, all in the browser.
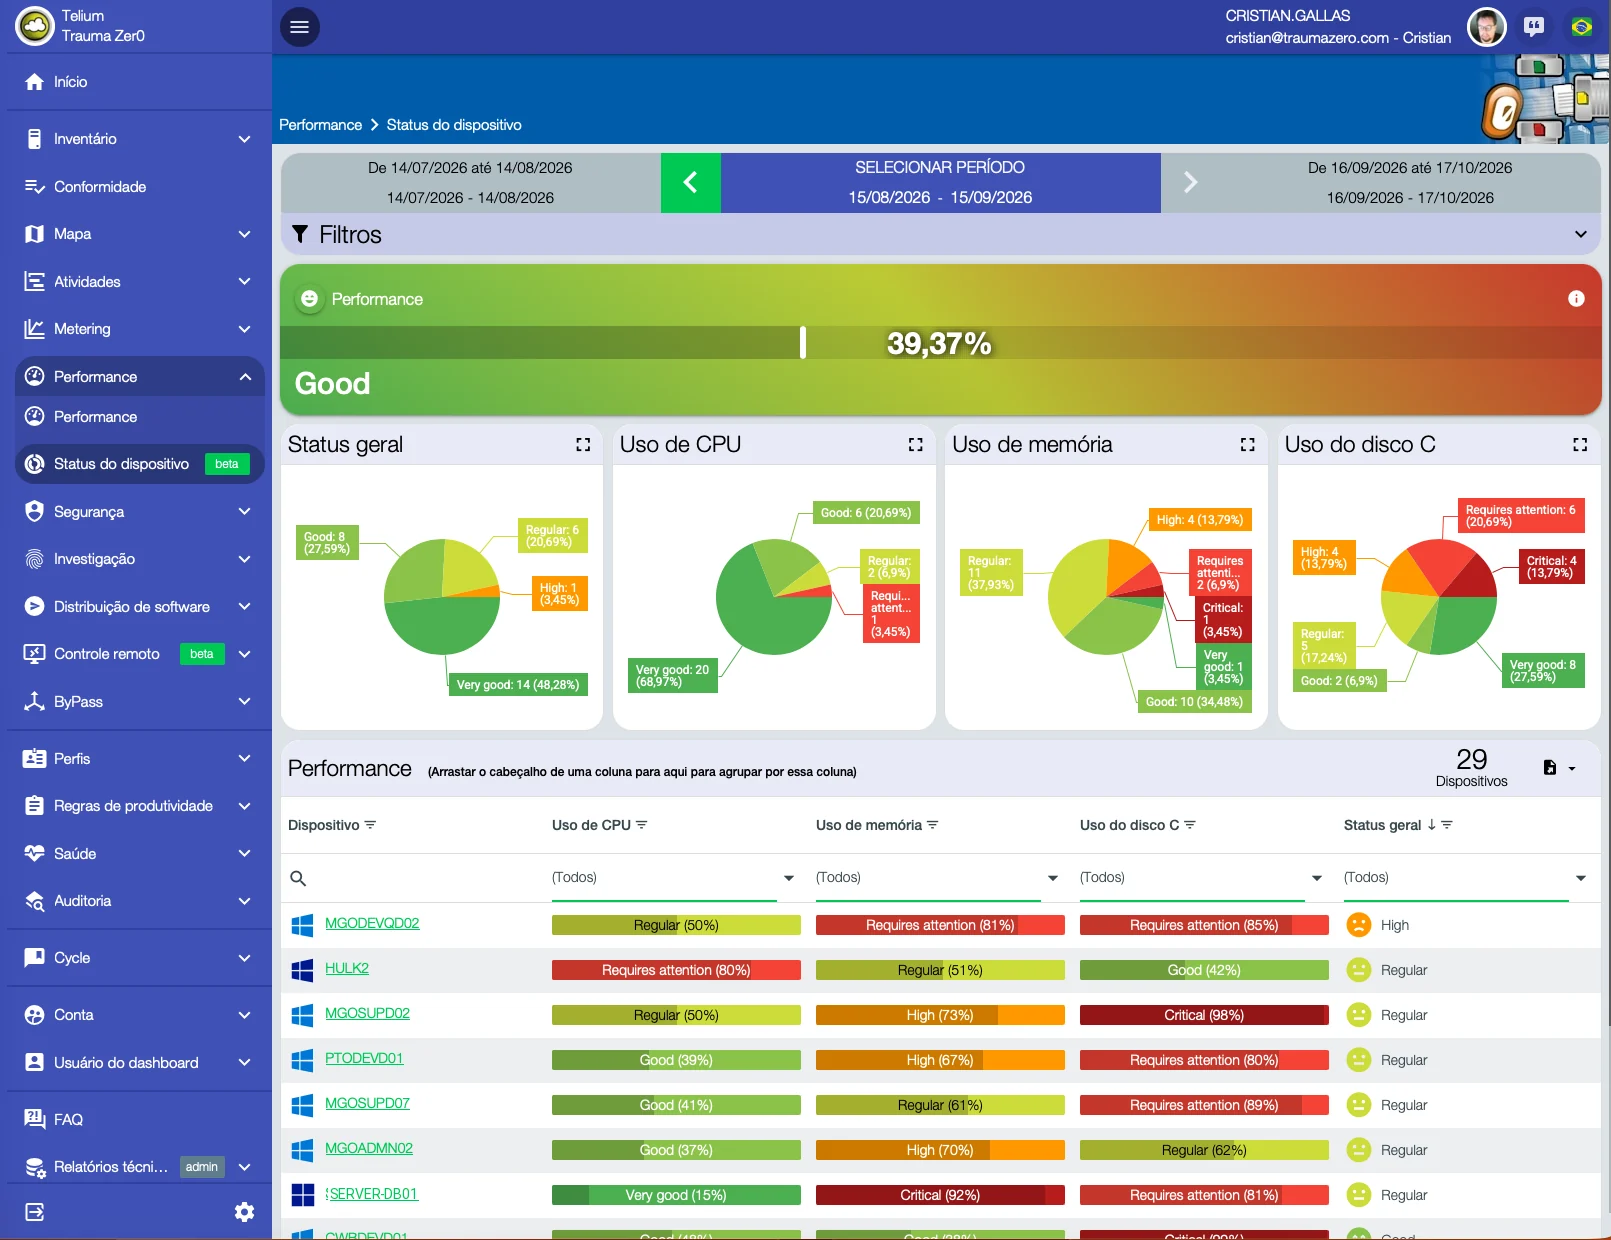
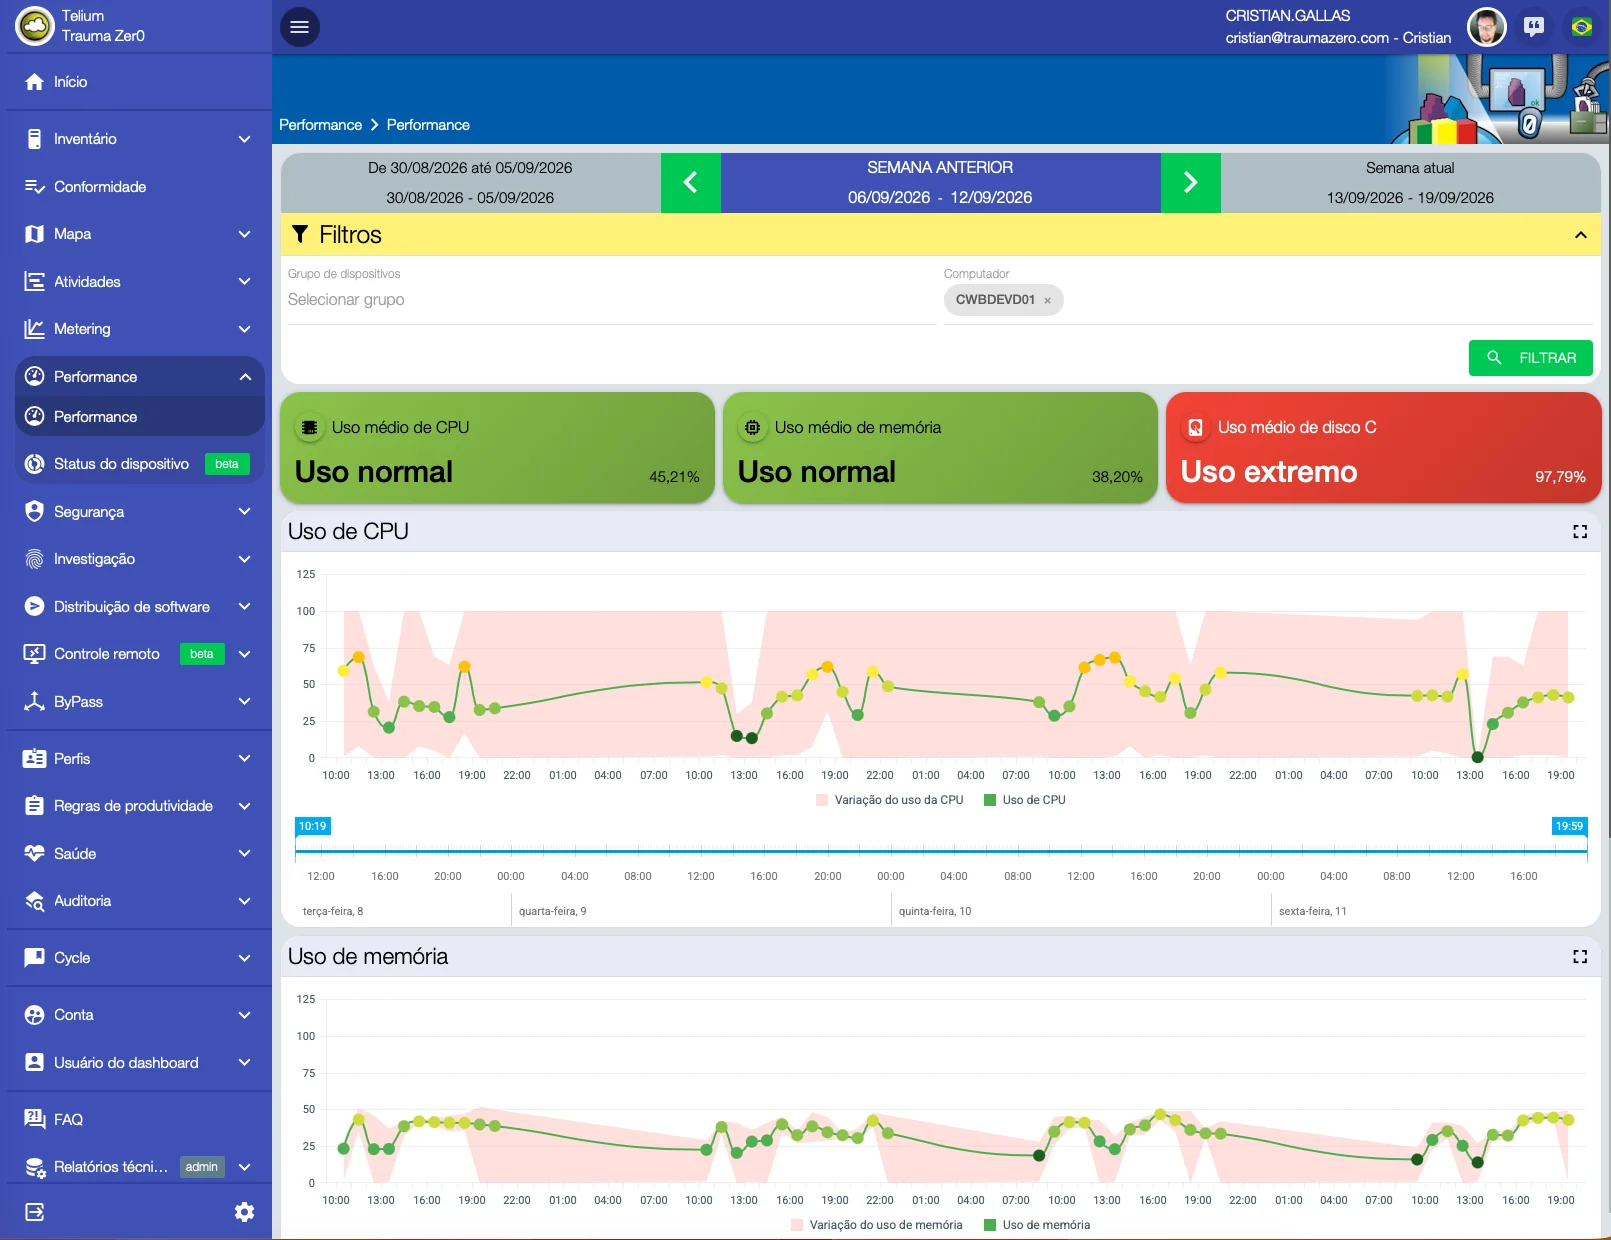
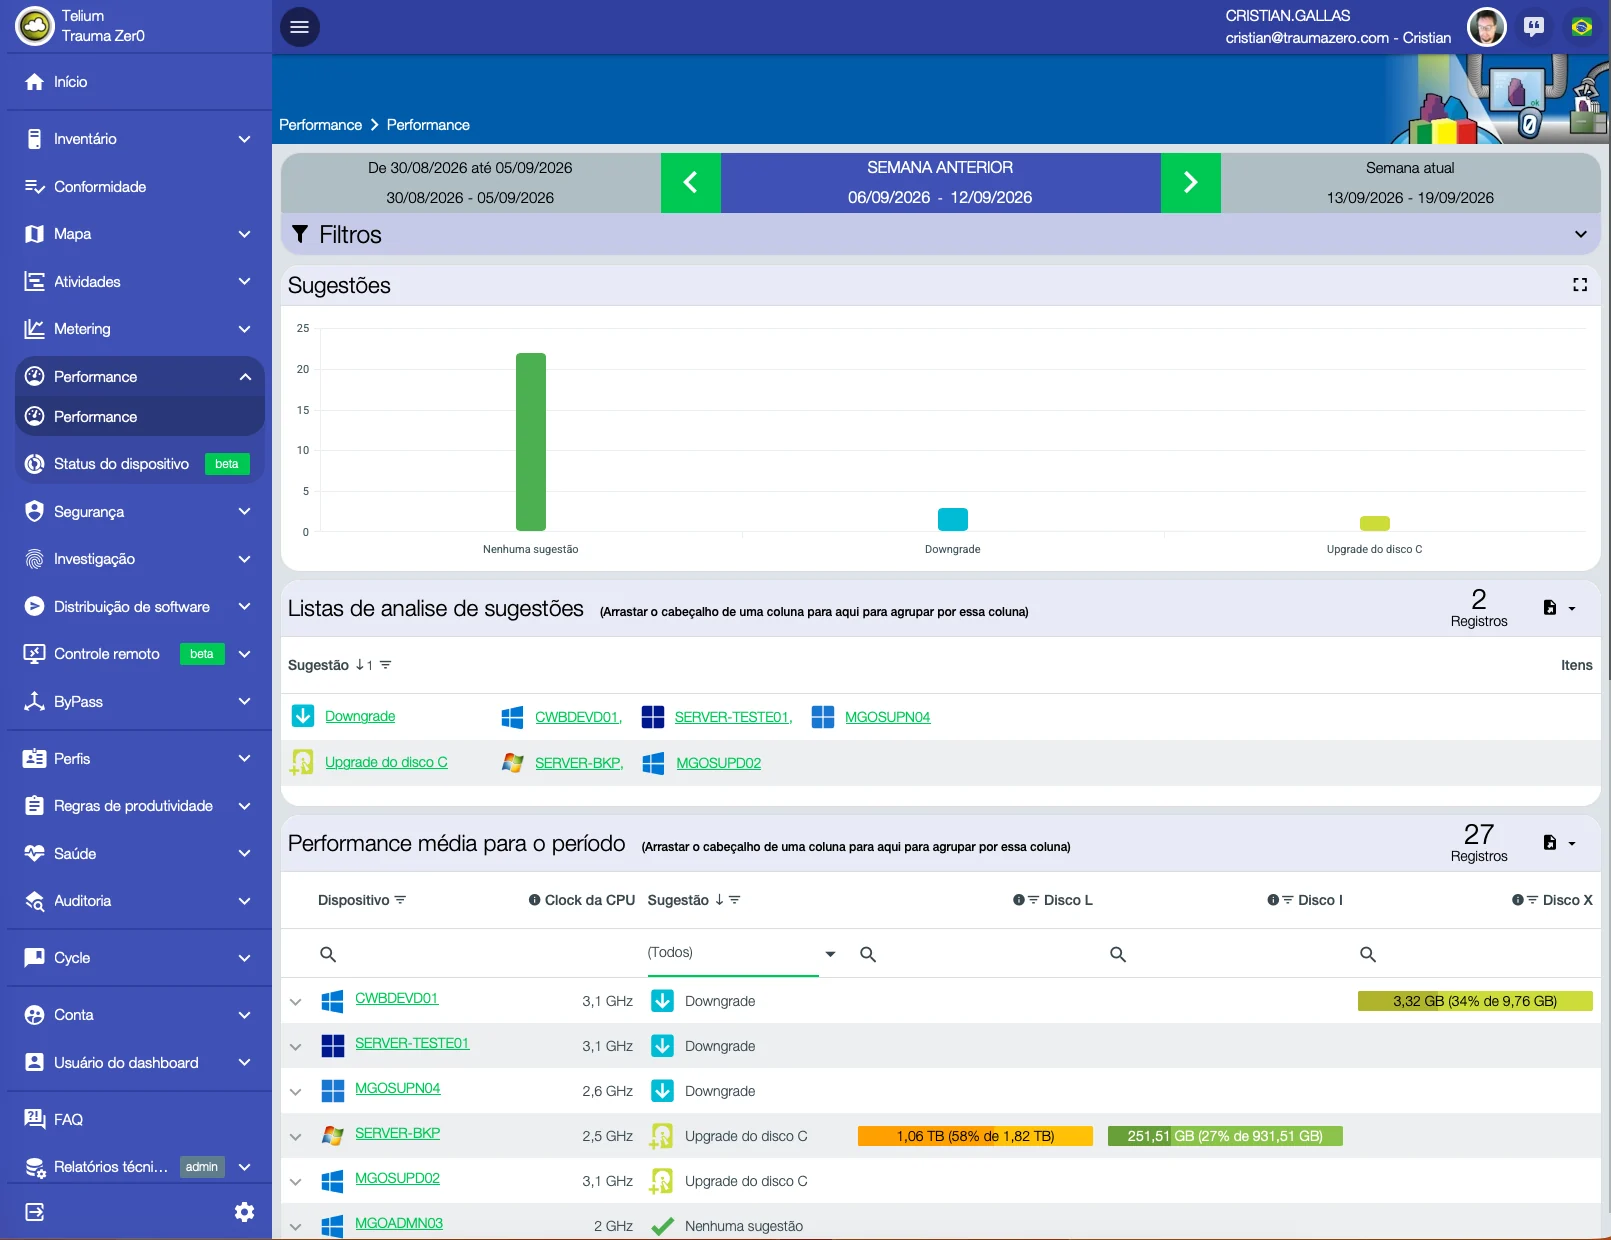
Screens from a real estate in production, not a demo environment. Machine identification was replaced with a generic equivalent before publishing; percentages, clock speeds, capacity and the interface itself are untouched.
Other modules