Platform  /  Tz0 Metering

Module · productivity and licensing

Tz0 Metering

Real software usage and team visibility

With part of the team at home, the question moved. It is no longer who is at the desk — it is what is being used, for how long and to what result, wherever the person happens to be.

Real-time measurement · the basis for renegotiating licences and seeing distributed work
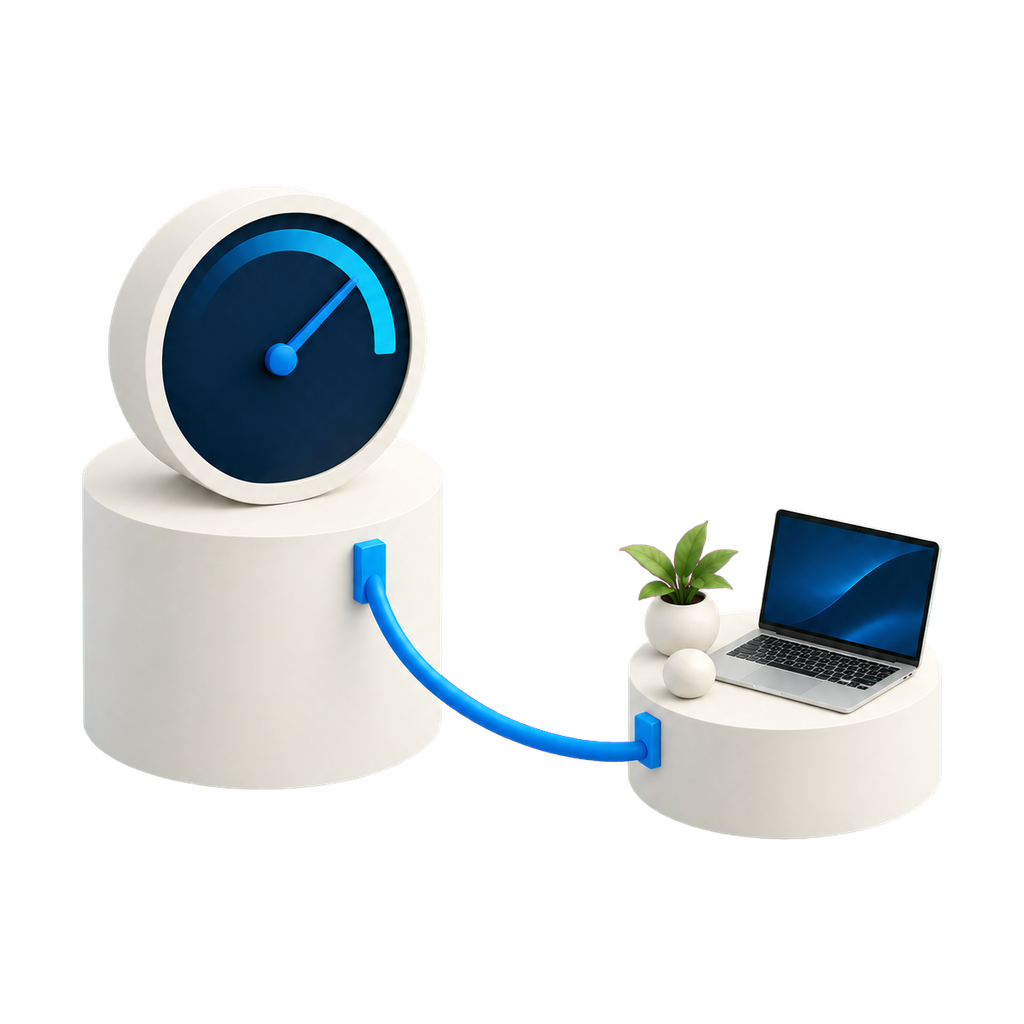
A large meter cabled to a laptop on a distant pedestal

Working from home

The distant machine produces numbers too.

A workstation at an employee’s home falls under the same measurement as one at head office — time in use, application open, a licence sitting idle. It is not a camera and it is not a screenshot: it is the same count, applying to people working from home as well.
tz0.suaempresa.local/metering/energia
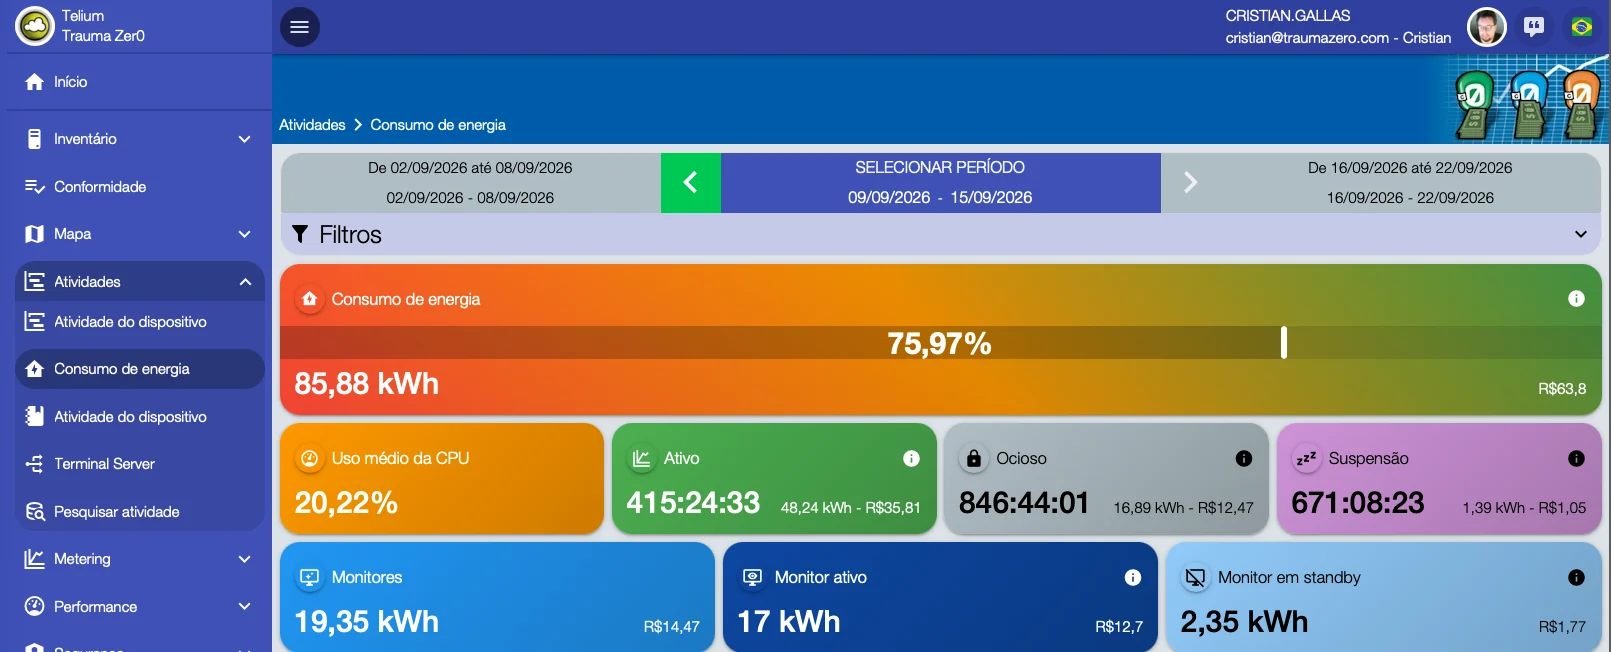
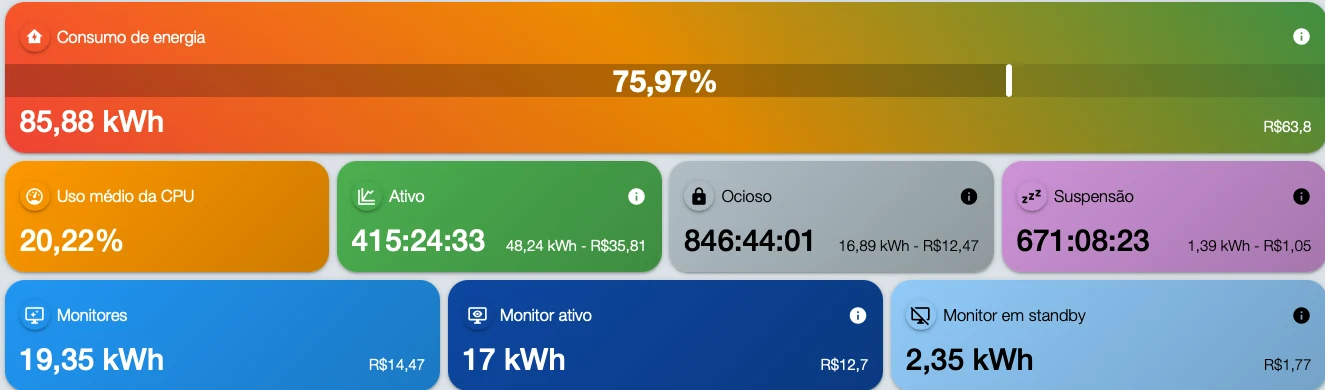
Energy consumption in the Tz0 console: 85.88 kWh and R$ 63.80 for the week, with active, idle and suspended time and the cost of each band
Tz0 Metering · web console

Console capture from an estate in production. Machine and person identification replaced; figures untouched.

What the module does

Measuring the work without watching the person.

The module measures resource use, not individual behaviour outside the scope of work. That is what separates productivity management from invasive monitoring — and it is what keeps its use within the LGPD, Brazil’s data protection law.

Real software usage

How long each program is actually used on each machine, in real time and with history.

Idle licences

The licence you pay for and nobody uses shows up before renewal. It is the line in the contract you can cut without anyone noticing.

Distributed teams

Working from home is work, and work gets measured. Visibility of people outside the office, on the same basis as those inside it.

Idle time and peaks

Identifies idle periods and overload periods — the basis for redistributing work instead of hiring.

One dashboard

One screen with what the team is using right now, by department, by project or by person.

Policy violation

Access to confidential data outside the authorised group becomes an alert, not a late discovery.

Without blocking applications

Improves performance by measuring and showing, without turning the workstation into a locked-down machine.

Windows, Linux and Android

Three platforms and three languages — Portuguese, English and Spanish — in one console.

How it works

From measured usage to a contract decision.

Measurement only counts if it becomes a decision. The path here ends in a renegotiated licence or redistributed work.

01 Measure The agent records real usage per application. 02 Classify Separates what is work from what is incidental. 03 Consolidate The Tz0 server builds a picture per department. 04 Compare Measured usage against the licences contracted. 05 Decide Cut the idle ones, redistribute the load. What is measured is a corporate resource on corporate equipment — and the data stays on the company server, not in a third-party service.

Console

From the dashboard to the report, all in the browser.
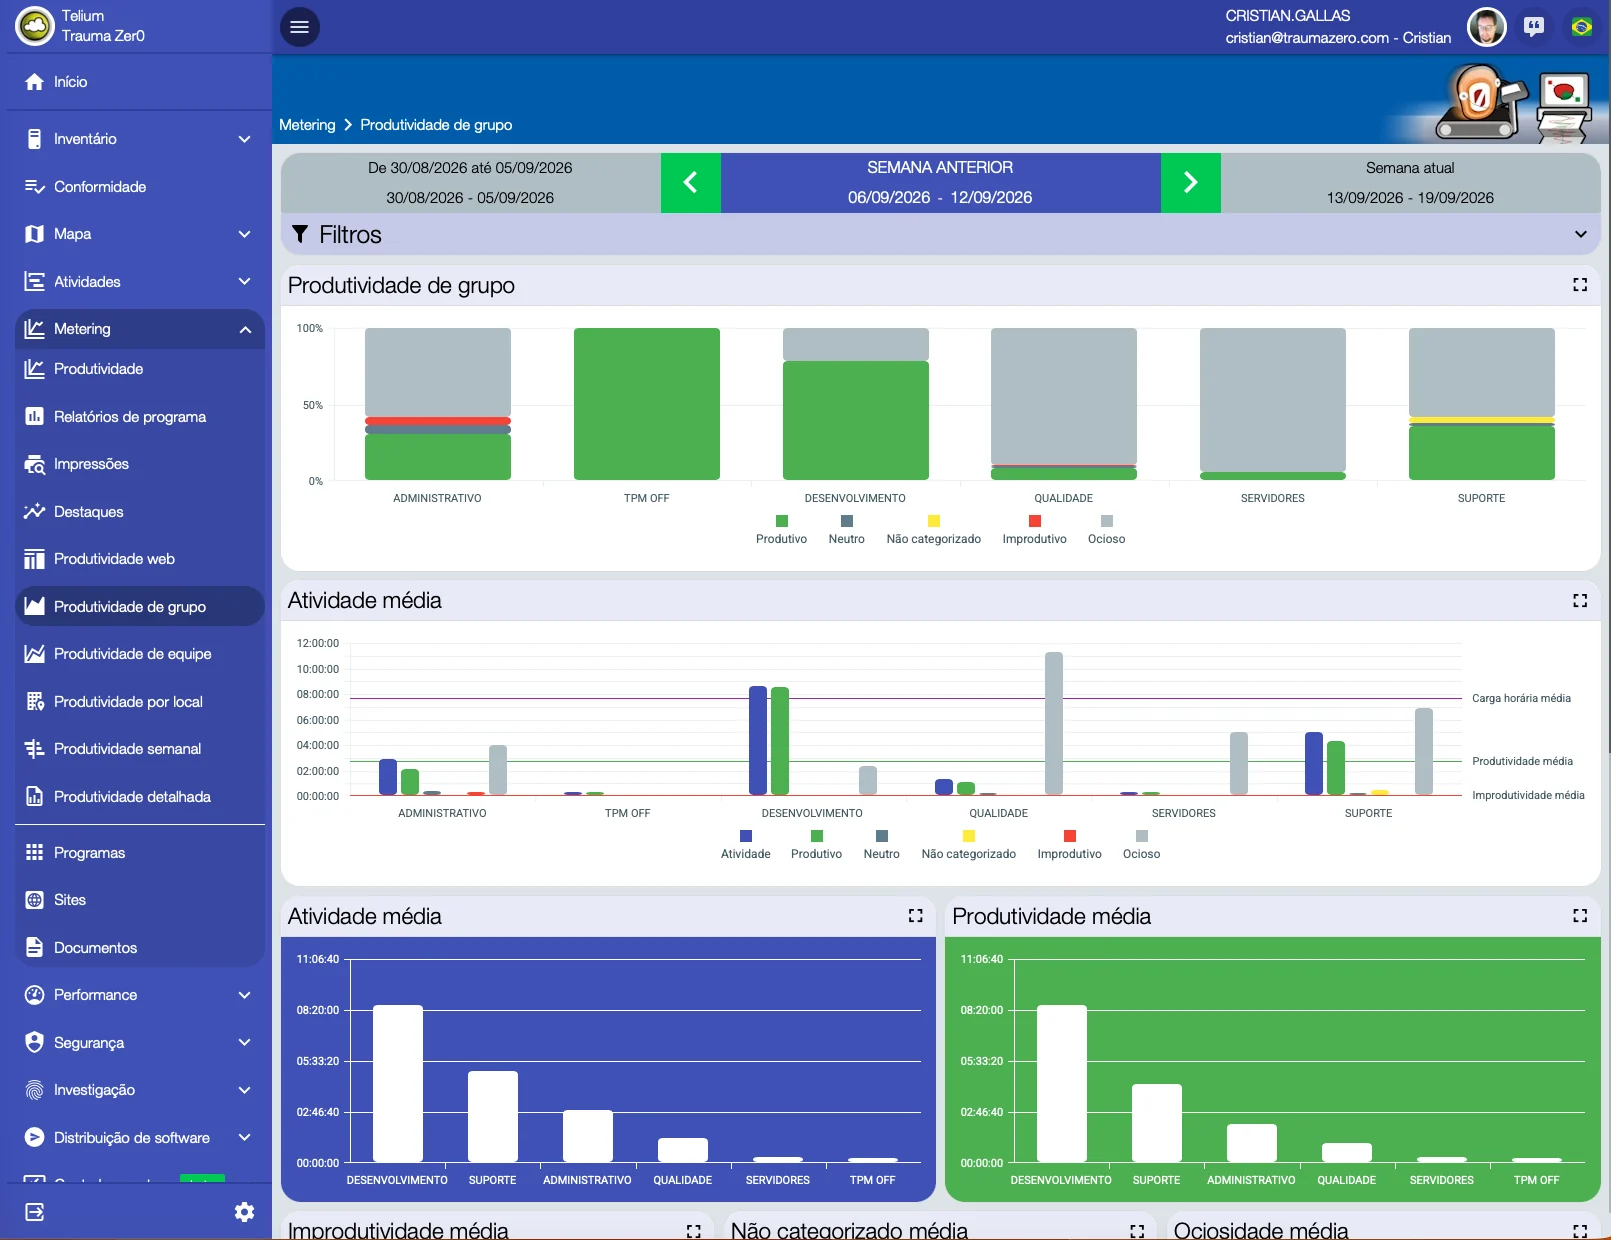
Group productivity screen in Tz0 Metering, comparing six groups across productive, neutral, uncategorised, unproductive and idle time over a week
Productivity by group. A full week, six groups, five bands — productive, neutral, uncategorised, unproductive and idle — measured against the average working-hours line. Nobody filled in a spreadsheet: the agent reported it.
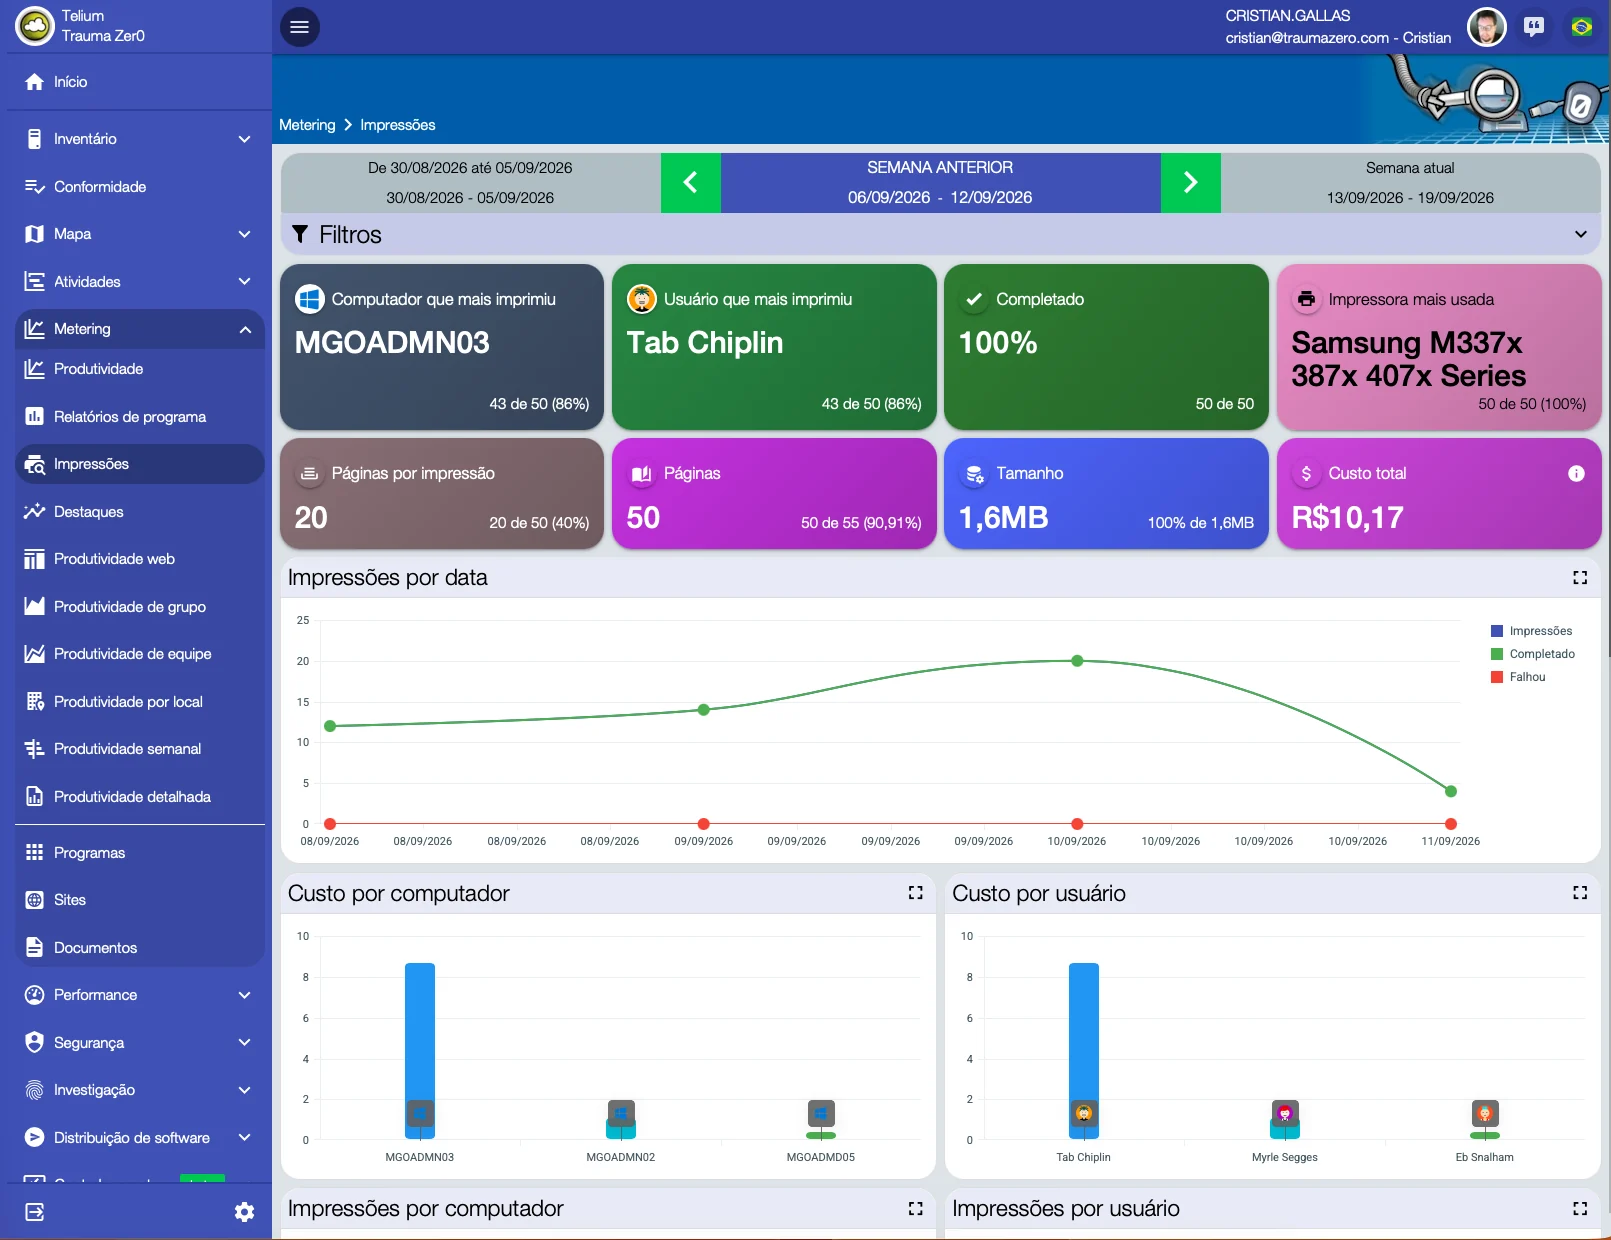
Printing screen in Tz0 Metering, with a total weekly cost of R$ 10.17, the most used printer and pages per job
Printing, down to the cent. 50 print jobs in the week, 50 pages, 1.6 MB and R$ 10.17 in cost — with the machine, the person and the printer that ran the most. Paper is inventory too.
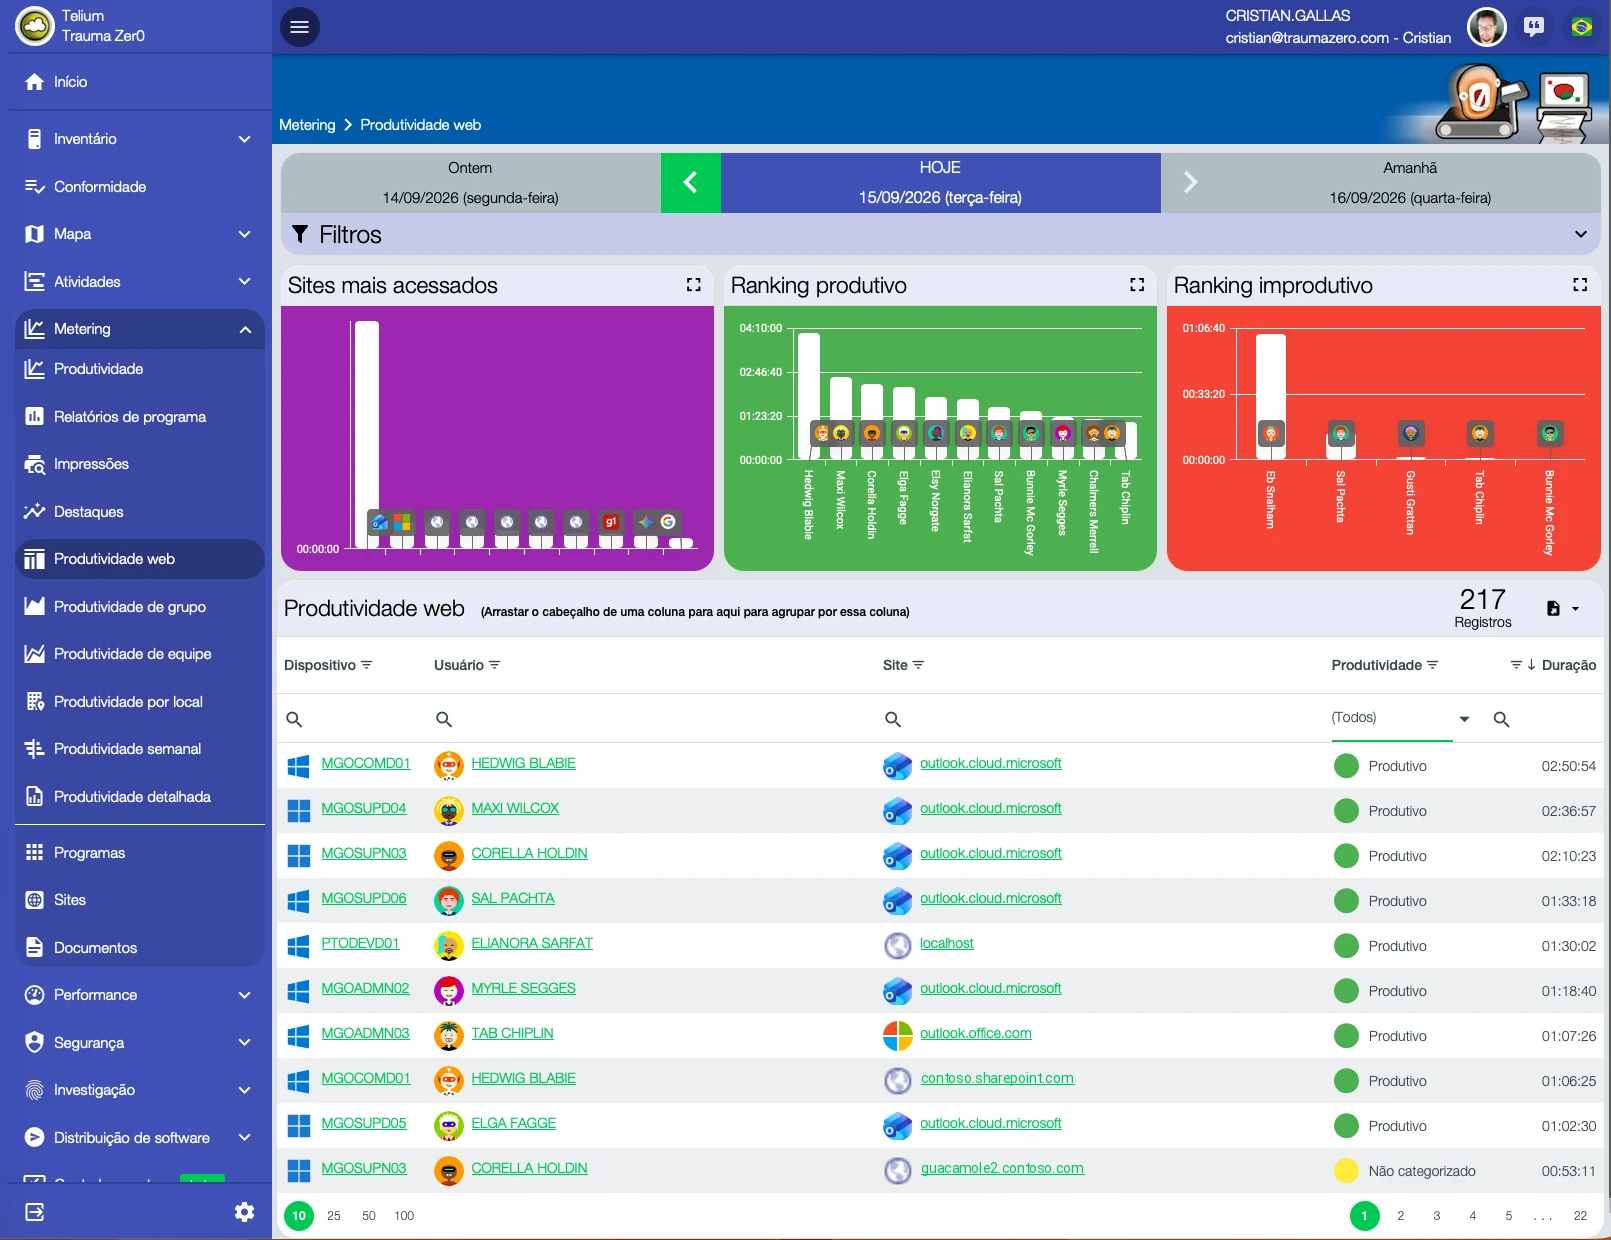
Web productivity screen in Tz0 Metering, with most visited sites, productive and unproductive rankings and 217 records for the day
Sites, by person and by time. 217 records in a single day: which site, on which machine, for how long and whether it counts as productive. The two rankings at the top already separate what pulls the day up from what pulls it down.
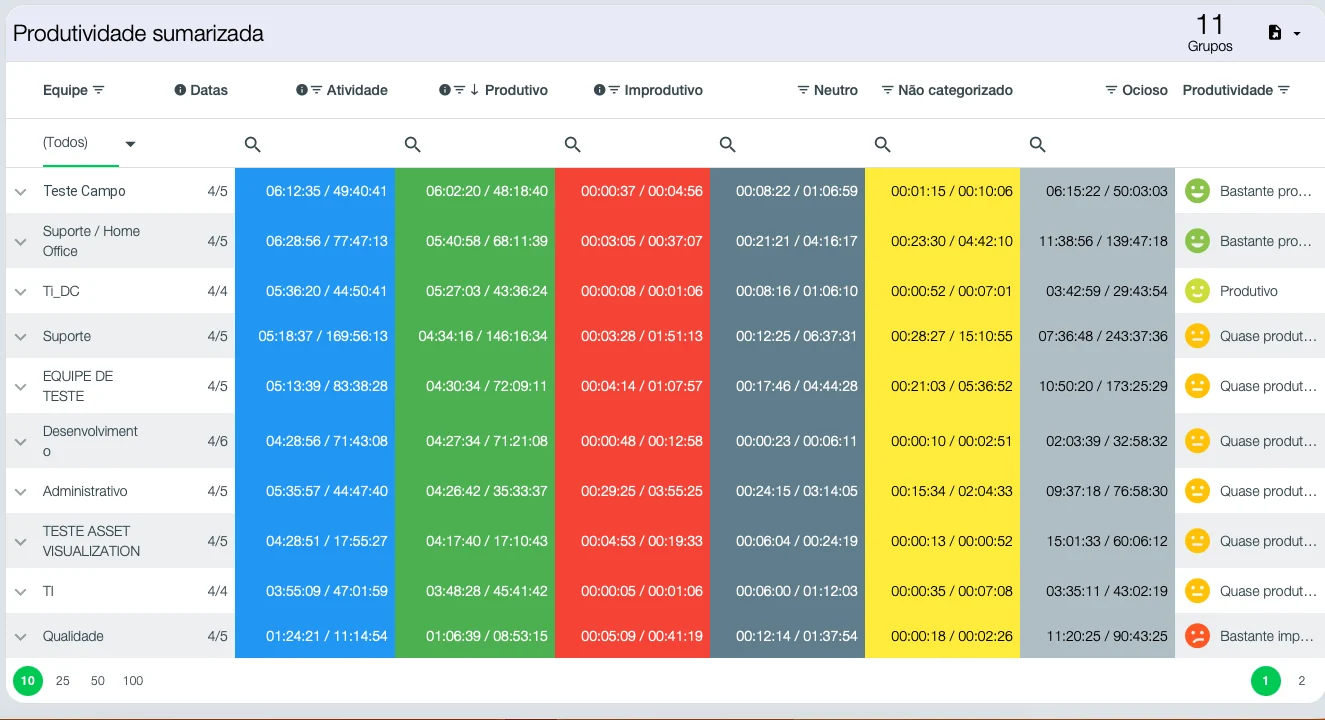
Summarised productivity table in Tz0 Metering, with eleven teams and a productivity verdict on each row
Eleven teams, one yardstick. Average and total side by side in every column — activity, productive, unproductive, neutral, uncategorised, idle — and a verdict at the end of the row, from “highly productive” to “highly unproductive”.
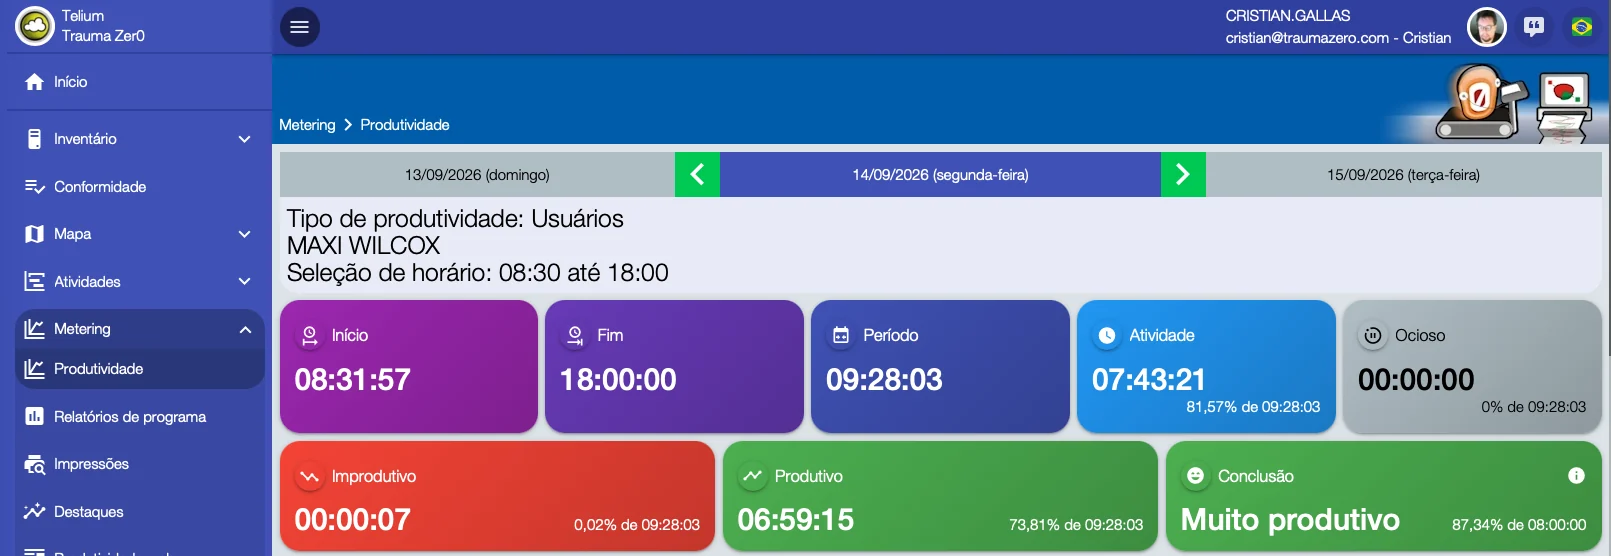
One user's day summarised in Tz0 Metering, with a 09:28:03 span, 07:43:21 of activity and a verdict of highly productive
One day, one person. From the group you drill down to the day: in at 08:31:57, out at 18:00:00, a span of 09:28:03, 07:43:21 of activity (81.57%) and 06:59:15 productive. Verdict: highly productive, 87.34% of an eight-hour day.
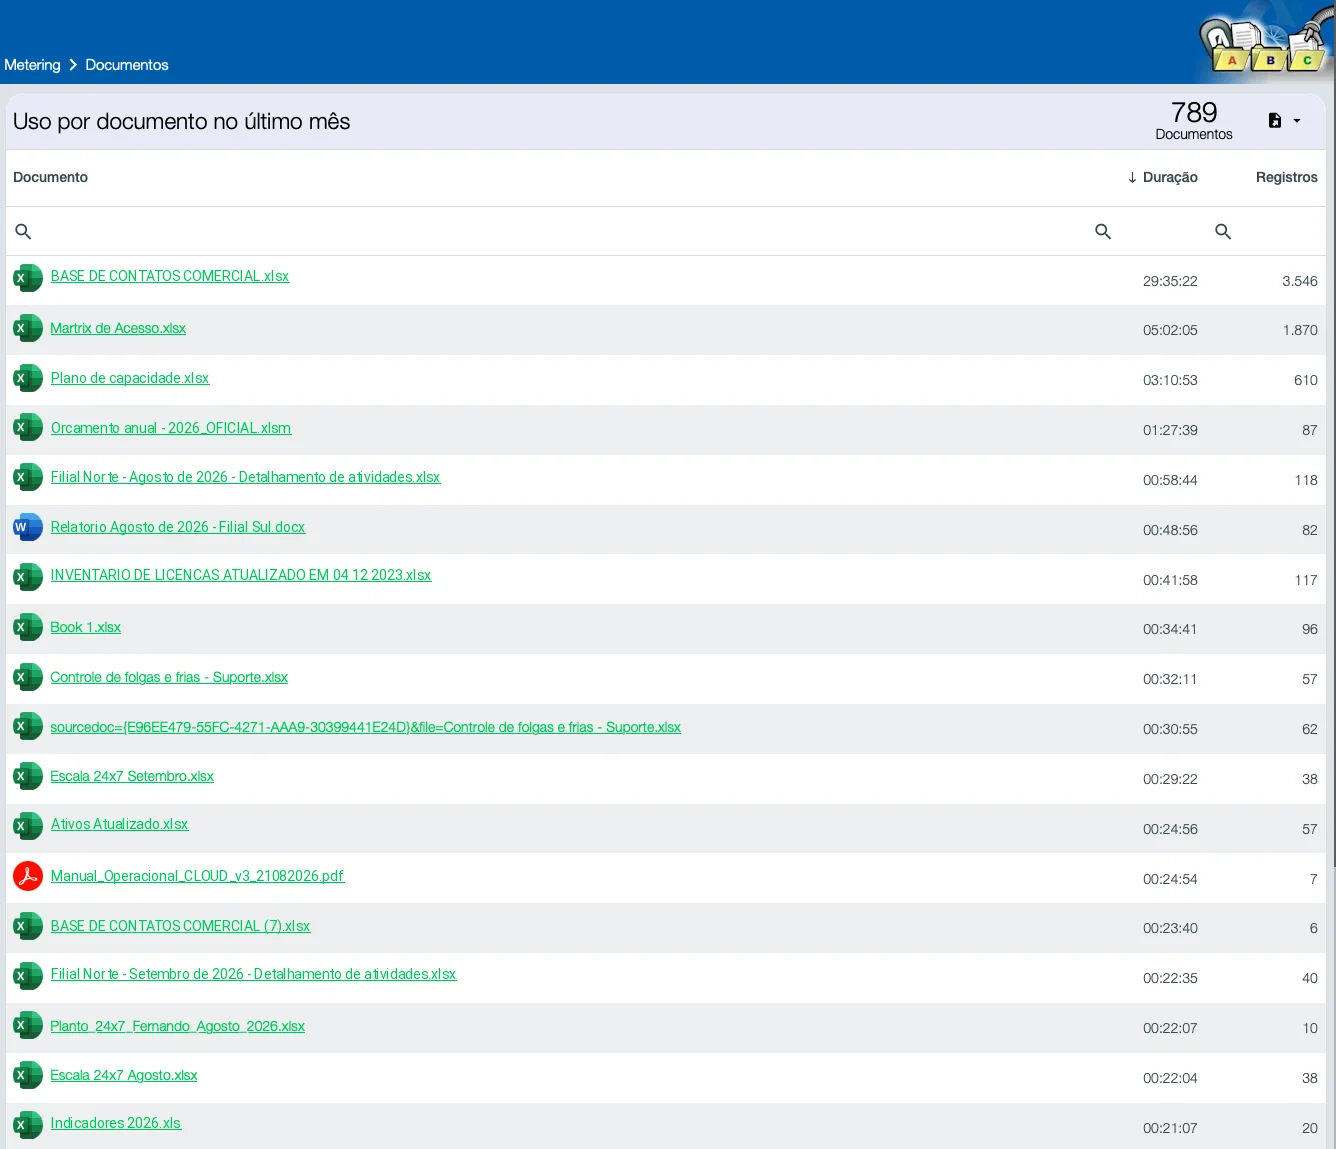
Per-document usage screen in Tz0 Metering, with 789 documents for the month ordered by how long they stayed open
By document, not just by program. 789 documents in the month, ordered by how long each stayed open — spreadsheets, text, PDFs, including those opened straight from SharePoint. This is what answers “where did the week go” when “everyone was in Excel” is not enough.
Energy consumption summary in Tz0, with 85.88 kWh and R$ 63.80 for the week, split across active, idle and suspended time
Energy, in kWh and in money. 85.88 kWh for the week, R$ 63.80 (figures from a Brazilian estate, in reais). And the number that matters: 415 hours of active machine time cost R$ 35.81 — while 846 idle hours, twice as long with nobody in front of the screen, cost R$ 12.47. Monitors are counted separately. Nothing here measures a person: it measures a machine left on.
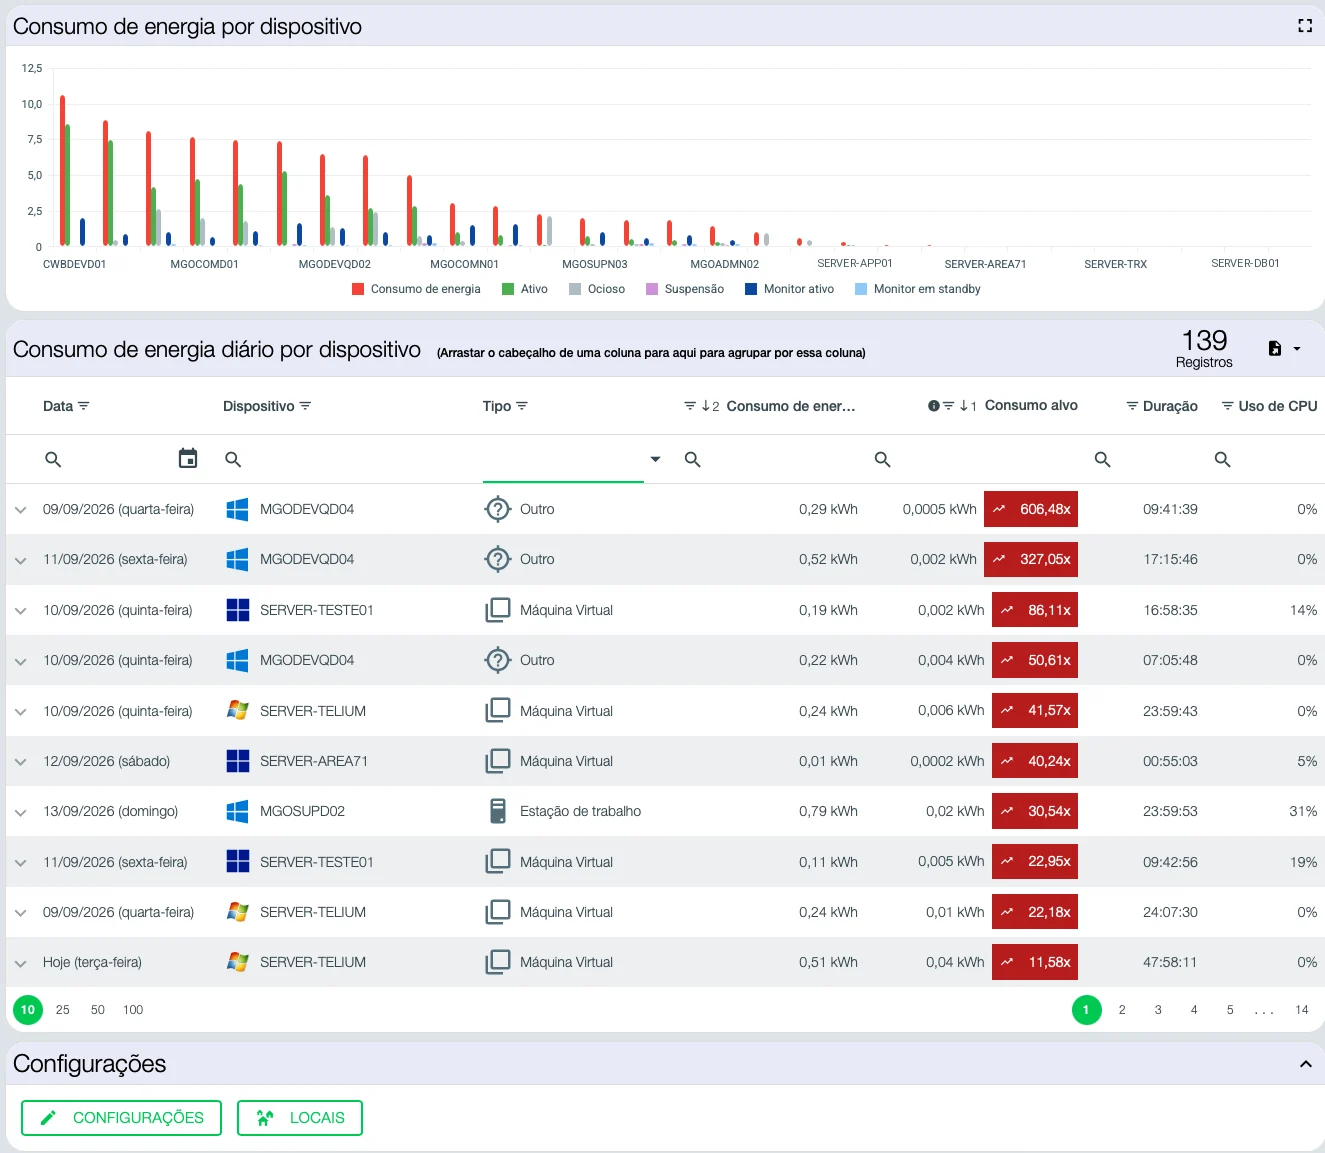
Per-device energy consumption in Tz0, with each machine's daily usage against its target and 139 records for the week
Per device, against expectation. Each device’s consumption, day by day, against its own target consumption — 139 records for the week, with duration and CPU usage alongside. The red badge counts how many times the machine went over. Target and kWh price are configured per site.

Screens from a real estate in production, not a demo environment. Anything identifying people, team names, document names and internal addresses was replaced with generic equivalents before publishing; figures, percentages and the interface itself are untouched.

What changes in practice

Eight questions that stop being guesswork.

How much of the licensing you pay for is genuinely in use.
Which contract can be cut at the next renewal.
Whether the team at home carries a load similar to the one in the office.
Where there is idle time and where there is overload, by department.
Whether usage of a critical piece of software has gone past what was contracted.
Who reached a confidential repository from outside the authorised group.
Which software the company pays for and nobody opens.
How to justify a cut or a purchase with data rather than impressions.

Included with the module

Three tools in the same package.

A new report does not become a project. We do not build bespoke work for a single customer, but we look at every request: when the need serves everyone, the report goes into the product and reaches all customers in the next update.

Tz0 EIS

Report builder

Ships with the package, not sold separately. It is for people who want to build their own reports outside the browser.

Tz0 TNetX

Development platform

Carries agent communication across segmented topologies and lets the product be extended.

Tz0 Dashboard

Operations dashboard

The state of the estate on one screen, with whatever went off-target at the top. More than 600 ready-made reports, covering every module.

Who works this way

Measure in order to stop spending.

“We cut costs with Tz0 — we stopped spending. Not spending is a gain too.”

Translated from Portuguese

Caldema
Manufacturing

“Tz0 Cycle gave the team more agility and more visibility over the company’s demands.”

Translated from Portuguese

RaiaDrogasil
Pharmacy retail

How much is your company paying for licences nobody opens?

A 30-minute technical conversation: you describe the software contracts, we show how Metering compares what is paid for with what is used.